目錄
What is the Google Lighthouse?
Lighthouse is a build-in extension in Chrome, and provides many tips for improving page load performance.
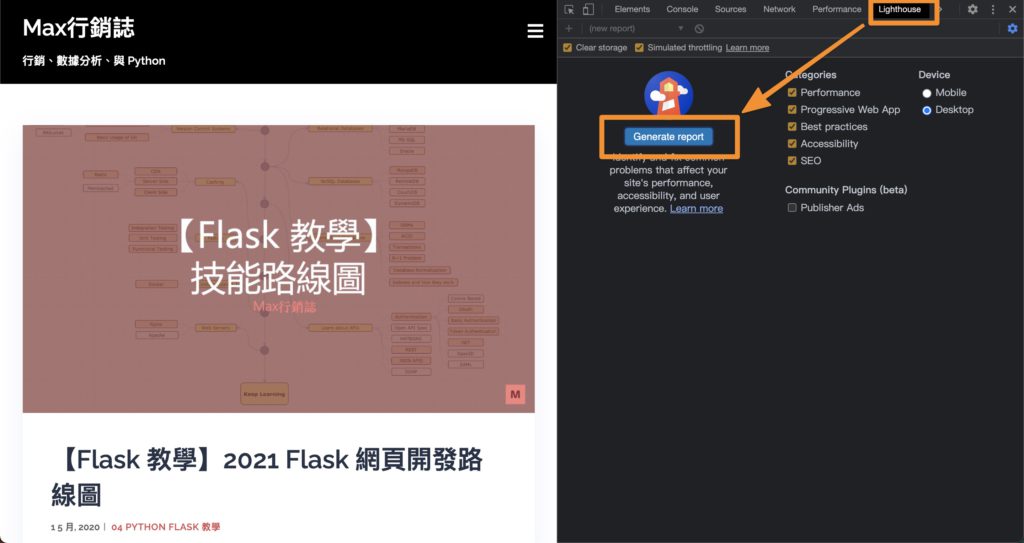
- First, open your Chrome and website page.
- Right-click and select inspect to open Chrome DevTools.
- Click Lighthouse
- Click Generate report
After generating the report, you can click the “See calculator” link
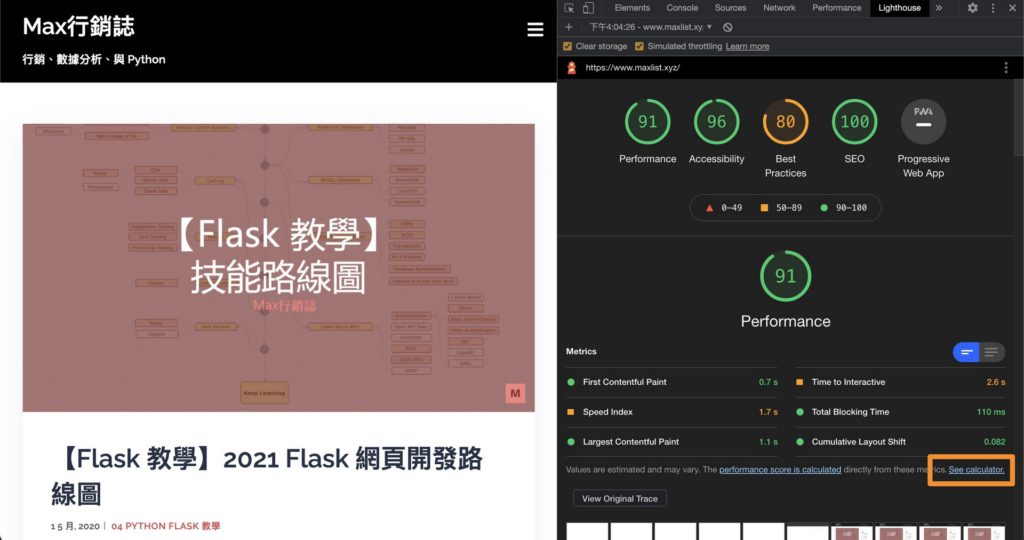
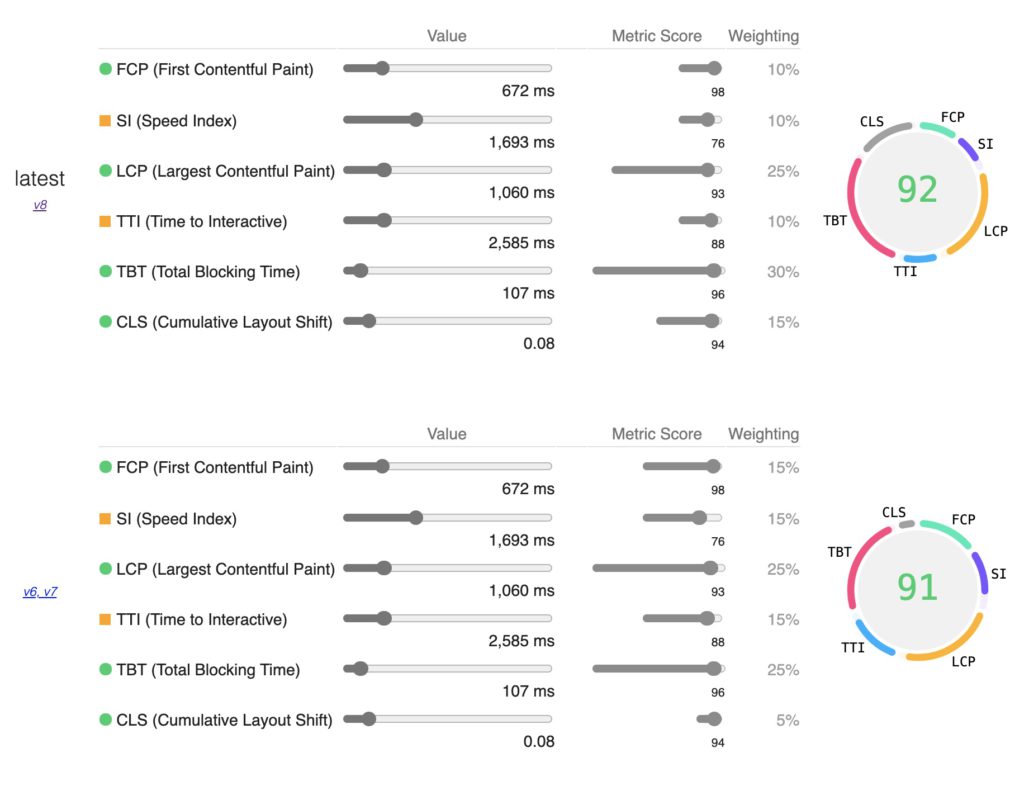
Open the link, and you will see the Performance Metrics weighting.
- TBT: 30%
- LCP: 25%
- CLS: 15%
- FCP: 10%
- SI: 10%
- TTI: 10%
What are the Performance Metrics & How to improve them?
1. LCP (Largest Contentful Paint)
1.1 What is LCP?
It’s been a challenge for web developers to measure how quickly the main content of a web page loads and is visible to users.
https://web.dev/lcp/
Sometimes simpler is better. Based on discussions in the W3C Web Performance Working Group and research done at Google, we’ve found that a more accurate way to measure when the main content of a page is loaded is to look at when the largest element was rendered.
LCP is the render time of the Largest Contentful Paint, and LCP should be visible to the user within the viewport. It can be a Text block, images, video, or background images.
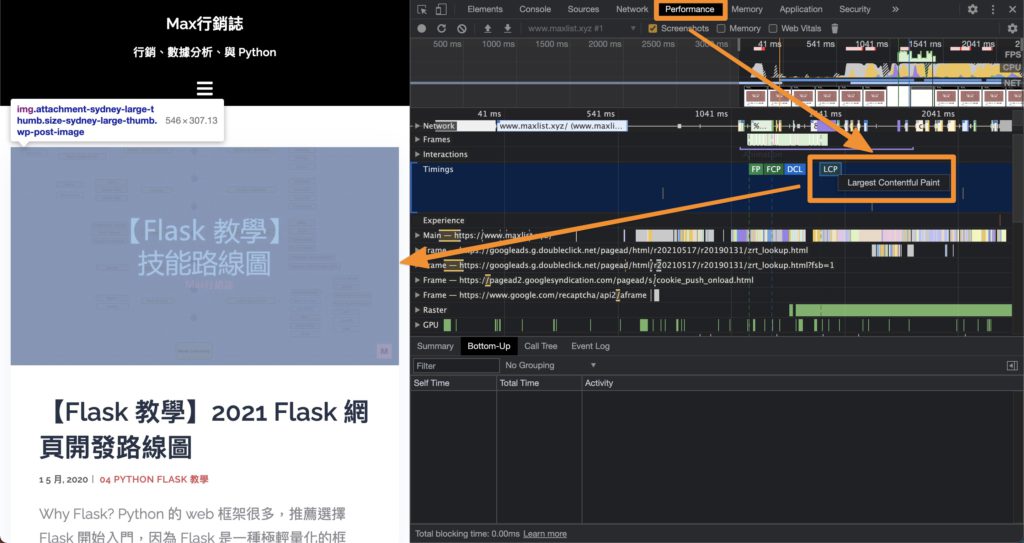
1.2 How to improve LCP?
Click the “LCP” label, and you can check the largest content on your page. (see the picture below)
There are a few ways you can do to improve LCP:
- Consider not using an image in the first place.
- Compress the image.
- Convert images into JPEG 2000, JPEG XR, or WebP formats.
- Using image CDN.
2. FCP (First Contentful Paint)
2.1 What is FCP?
FCP is the time from when the browser renders the first piece of content, “content” refers to text, images (including background images), <svg> elements.
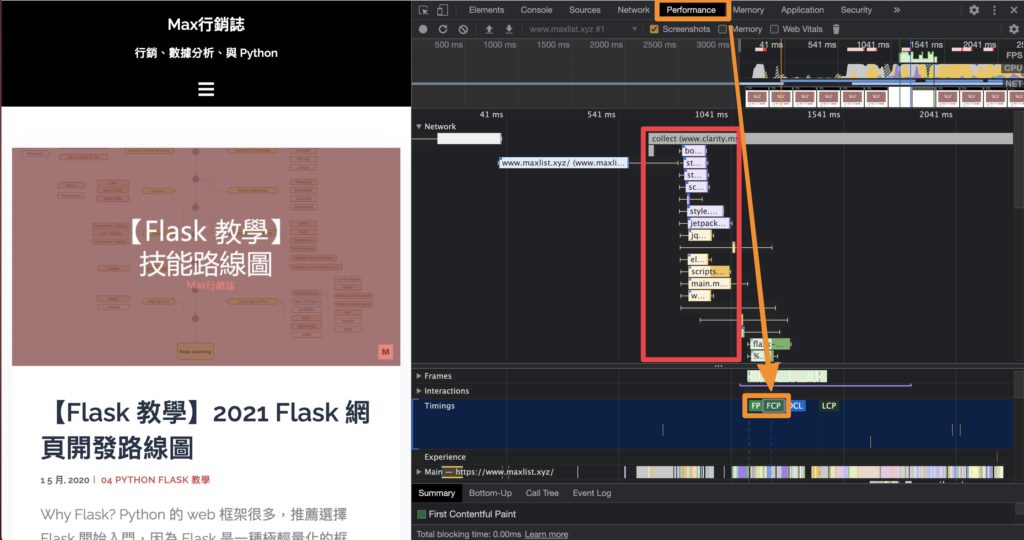
2.2 How to improve FCP?
Minify and reduce Html/CSS/JS code that is rendered before FCP content. (see the picture below)
For example, you can split CSS into two parts – critical (required for immediate rendering) and non-critical. Add the <link rel="preload"> for non-critical:
|
1 2 |
<link rel="stylesheet" href="critical.css" /> <link rel="preload" href="non-critical.css" as="style" /> |
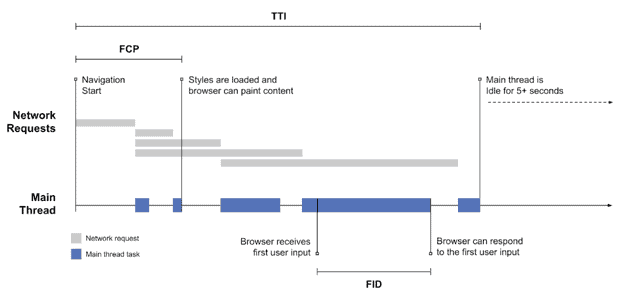
3. TBT (Total Blocking Time)
3.1 What is TBT?
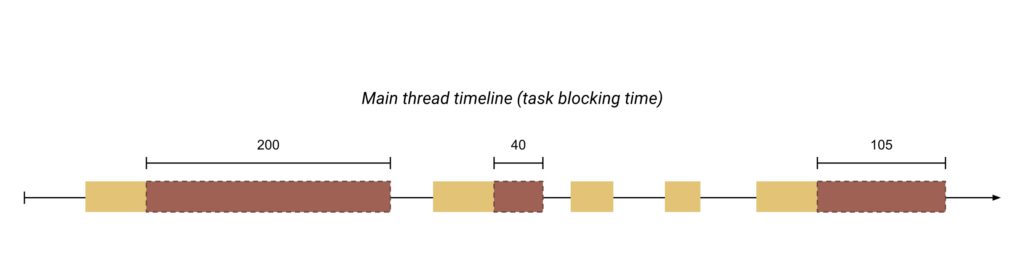
TBT is the total amount of time between FCP (First Contentful Paint), and TTI (Time to Interactive) where the task was blocked for more than 50 milliseconds (ms).
3.2 How to improve TBT?
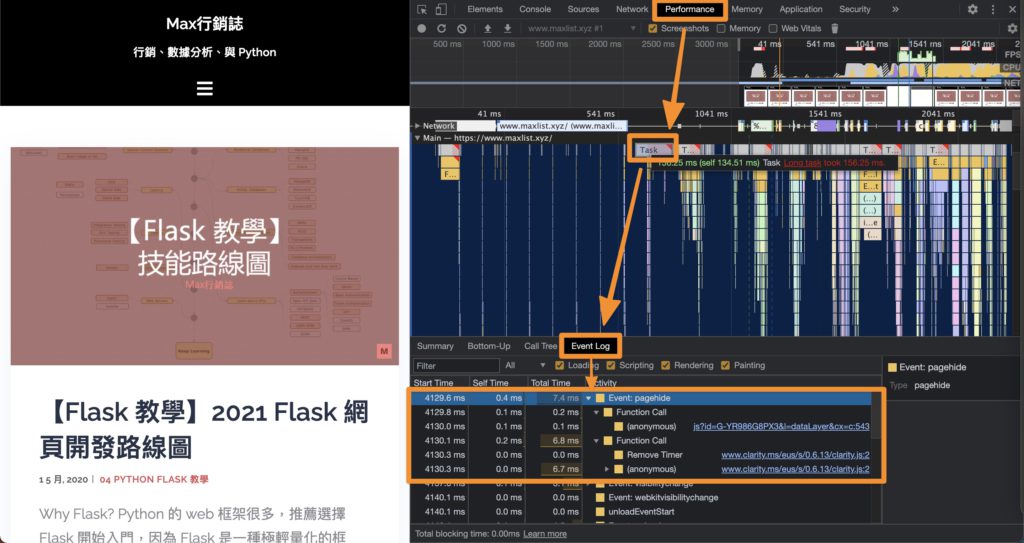
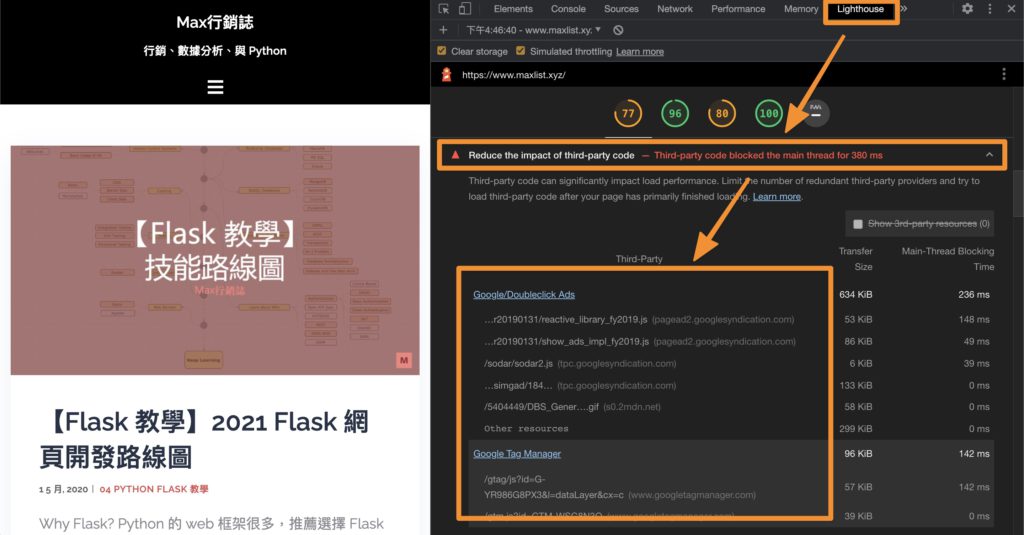
Find the long task, it will be tag with the red flag in the Chrome DevTools. (see the picture below)
There are a few ways you can do to improve TBT:
- Minify and reduce unused Html/CSS/JS code.
- Reduce or delay the third-party code.
- Reduce JavaScript execution time.
- Serve static assets with the cache.
If you are looking for a third-party code, you can follow the below step to finding out what third-party code you used on your website.
4. TTI (Time to Interactive)
4.1 What is TTI?
The TTI measures how long it takes a page to become fully interactive. For example, if the site appears ready, nothing happens when the user tries to interact, it will make the user having a bad experience that why we need the TTI metric.
4.2 How to improve TTI?
- Minify and reduce unused Html/CSS/JS code.
- Reduce JavaScript execution time.
- Serve static assets with the cache.
5. SI (Speed Index)
5.1 What is SI?
SI is the time from when the browser renders the first piece of content to the visually complete. This metric will show how quickly content display during page load.
5.2 How to improve SI?
- Minify and reduce unused Html/CSS/JS code.
- Reduce JavaScript execution time.
- Serve static assets with the cache.
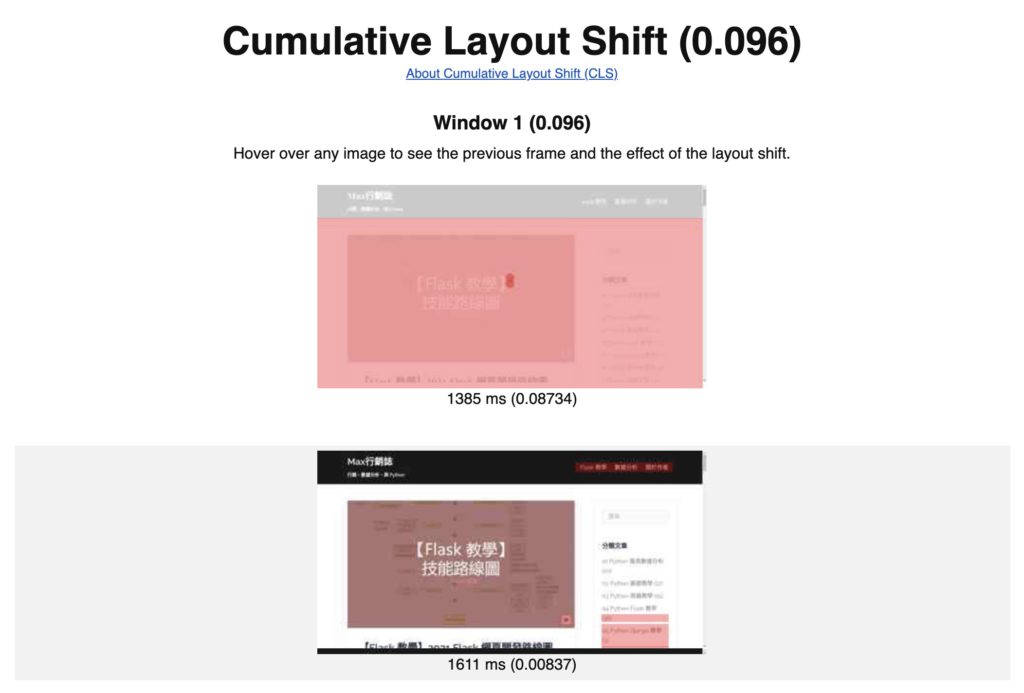
6. CLS (Cumulative Layout Shift)
6.1 What is CLS?
CLS is a metrics that calculate all layout shift in the webpage, which is calculated by: Impact fraction * distance fraction = layout shift score
In the example, the scores will be: 0.75 (impact viewport, red frame) x 0.25 (distance)
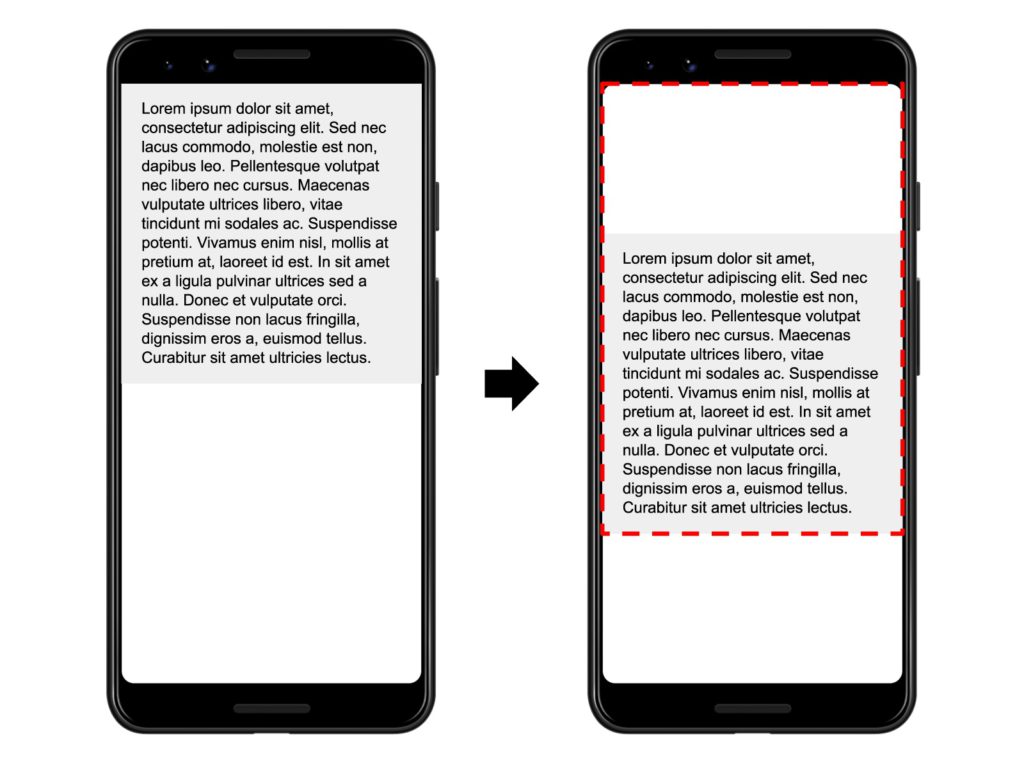
The layout shift common cases:
- image didn’t set the Height And Width
- Ads, videos, iframe without dimensions
- Late-loading CSS and Web fonts
- Dynamically injected content
6.2 How to improve CLS?
You can use Chrome DevTools or webpagetest tool to find the CLS viewport.
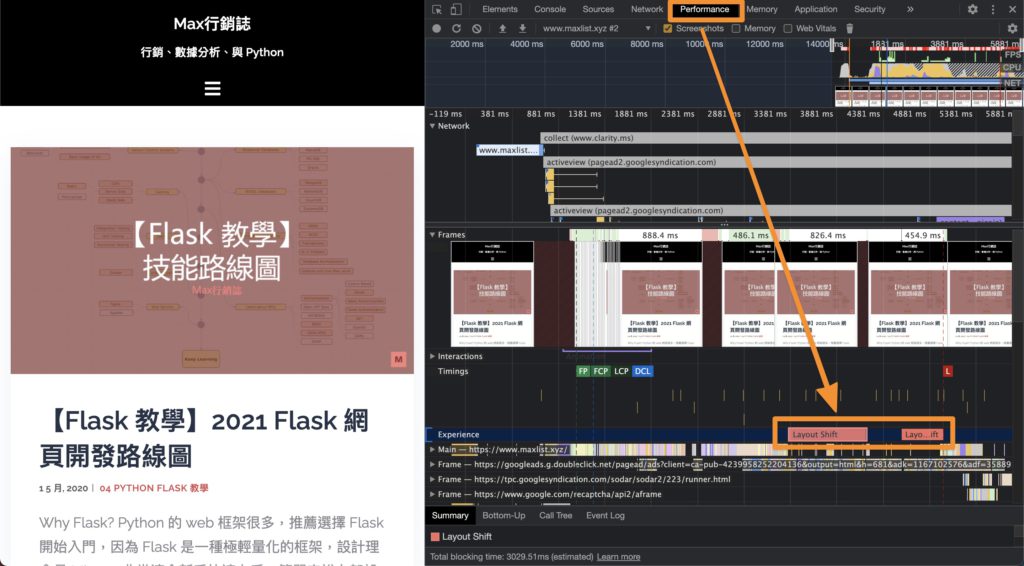
There are a few ways you can do to improve CLS:
- Avoid placing ads near the top of the viewport
- Always include size attributes on your images and video elements
- Reserve sufficient space in the viewport for dynamically injected content
Thanks for your reading. I hope this article will help you better understand the Lighthouse Performance Metrics and improve your Page Performance.
References: