Table
About Data Source
First of all, the dataset comes from Singapore’s Public Data, and the rental is based on the declaration by the flat owner. Please notes the HDB does not verify the accuracy of the data.
- Source: Singapore’s Public Data
- Dataset: Renting Out of Flats
- Coverage: July 2021 to Oct 2022
- Frequency: Monthly
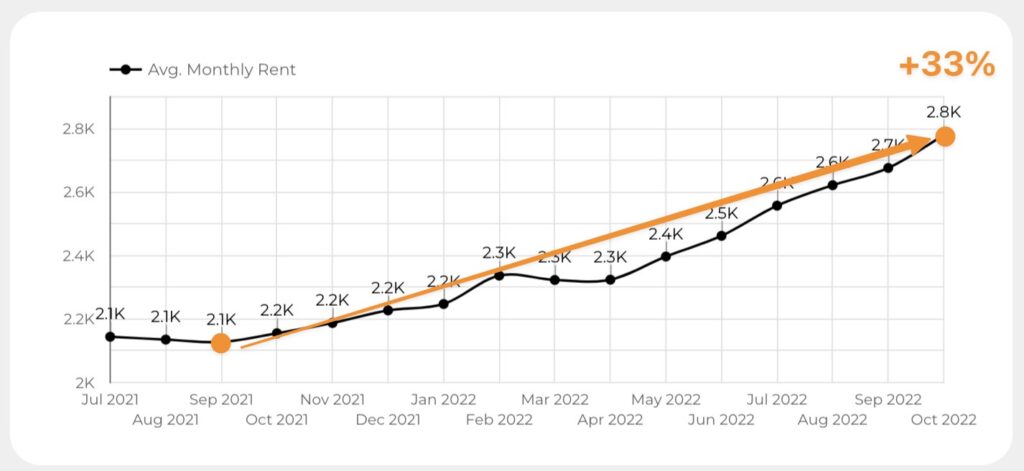
Overall Avg. Monthly Rent
Let’s start by looking at the overall, the avg. monthly rent increased 33% (compared with last Aug data), and we can see the rent continued to rise.

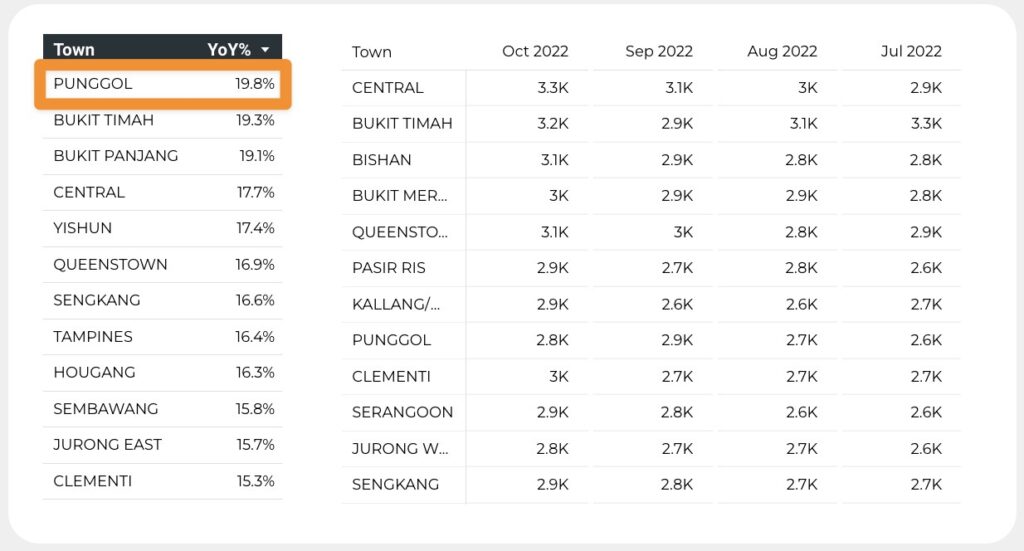
Breakdown by town
Then, we look closely at the breakdown by town, and the top increase comes from Punggol (+19.8%), Bukit TIMAH (+19.3%), Bukit Panjang (+19.1%), CENTRAL (+17.7%), and Yishun (17.4%). You can see the top increase mostly comes from the North East region.
* YoY%: (Avg. this year / Avg. last year) -1

Breakdown by flat type
Next, we break it down by the flat type, and the top increased comes from executive type (YoY 15.7%).
* executive type: the executive is an HDB flat which comes with an additional space that can be used as a study room or a living room.
* YoY%: (Avg. this year / Avg. last year) -1

Now is your time
I created one dashboard for you. Try it to check the HDB rental nearby and If you have any questions, feel free to let me know!

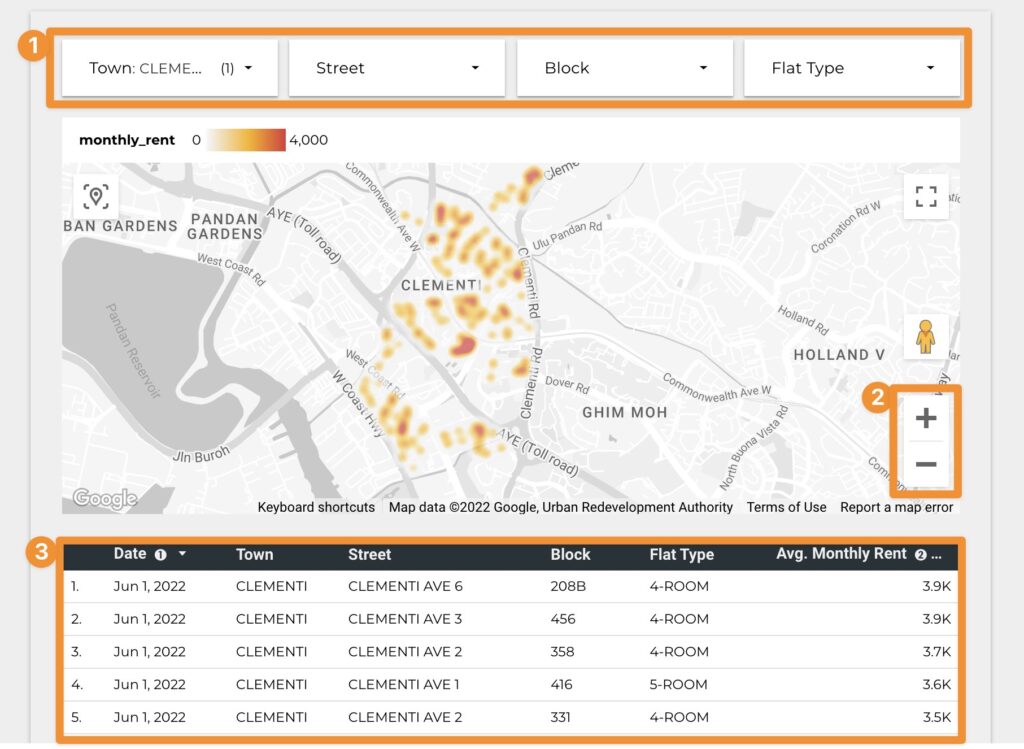
The components in this dashboard:
- Filter: you can choose filter data by Town, Street, Block or Flat type.
- Map control: you can use the “+” and “-” button to scroll the map.
- Table: you can see more detail data here.
Just wait a second and you will see the DataStudio dashboard below.
Thanks for your reading. I hope this article will help you better understand the HDB Rental Price in Singapore.
